
As cloud computing continues to reshape how we conduct business, Gartner predicts that by 2026, 75% of organizations will adopt a digital transformation model with the cloud as the fundamental underlying platform. As businesses harness this technology, they face the challenge of navigating increasingly complex cloud environments. And this is where the concept of cloud visualization comes into play – a critical tool in demystifying the complexities of cloud infrastructures.
In this blog, we’ll now dive into the what, how, and why of cloud visualization, highlighting its role in transforming cloud management and business strategies.
What is Cloud Visualization
Cloud visualization is a technique for graphically representing cloud infrastructure, showcasing the intricate network of relationships among various cloud resources. Utilizing diagrams, charts, and other visual tools, it paints a detailed picture of a cloud environment’s structure and interactions.
In the realm of cloud computing, where environments are complex and constantly evolving, cloud visualization plays a vital role. It transforms the often challenging task of managing and understanding dynamic systems of data and applications into a more accessible and understandable form, making it an indispensable tool for businesses leveraging cloud technology.
How Does Cloud Visualization Work
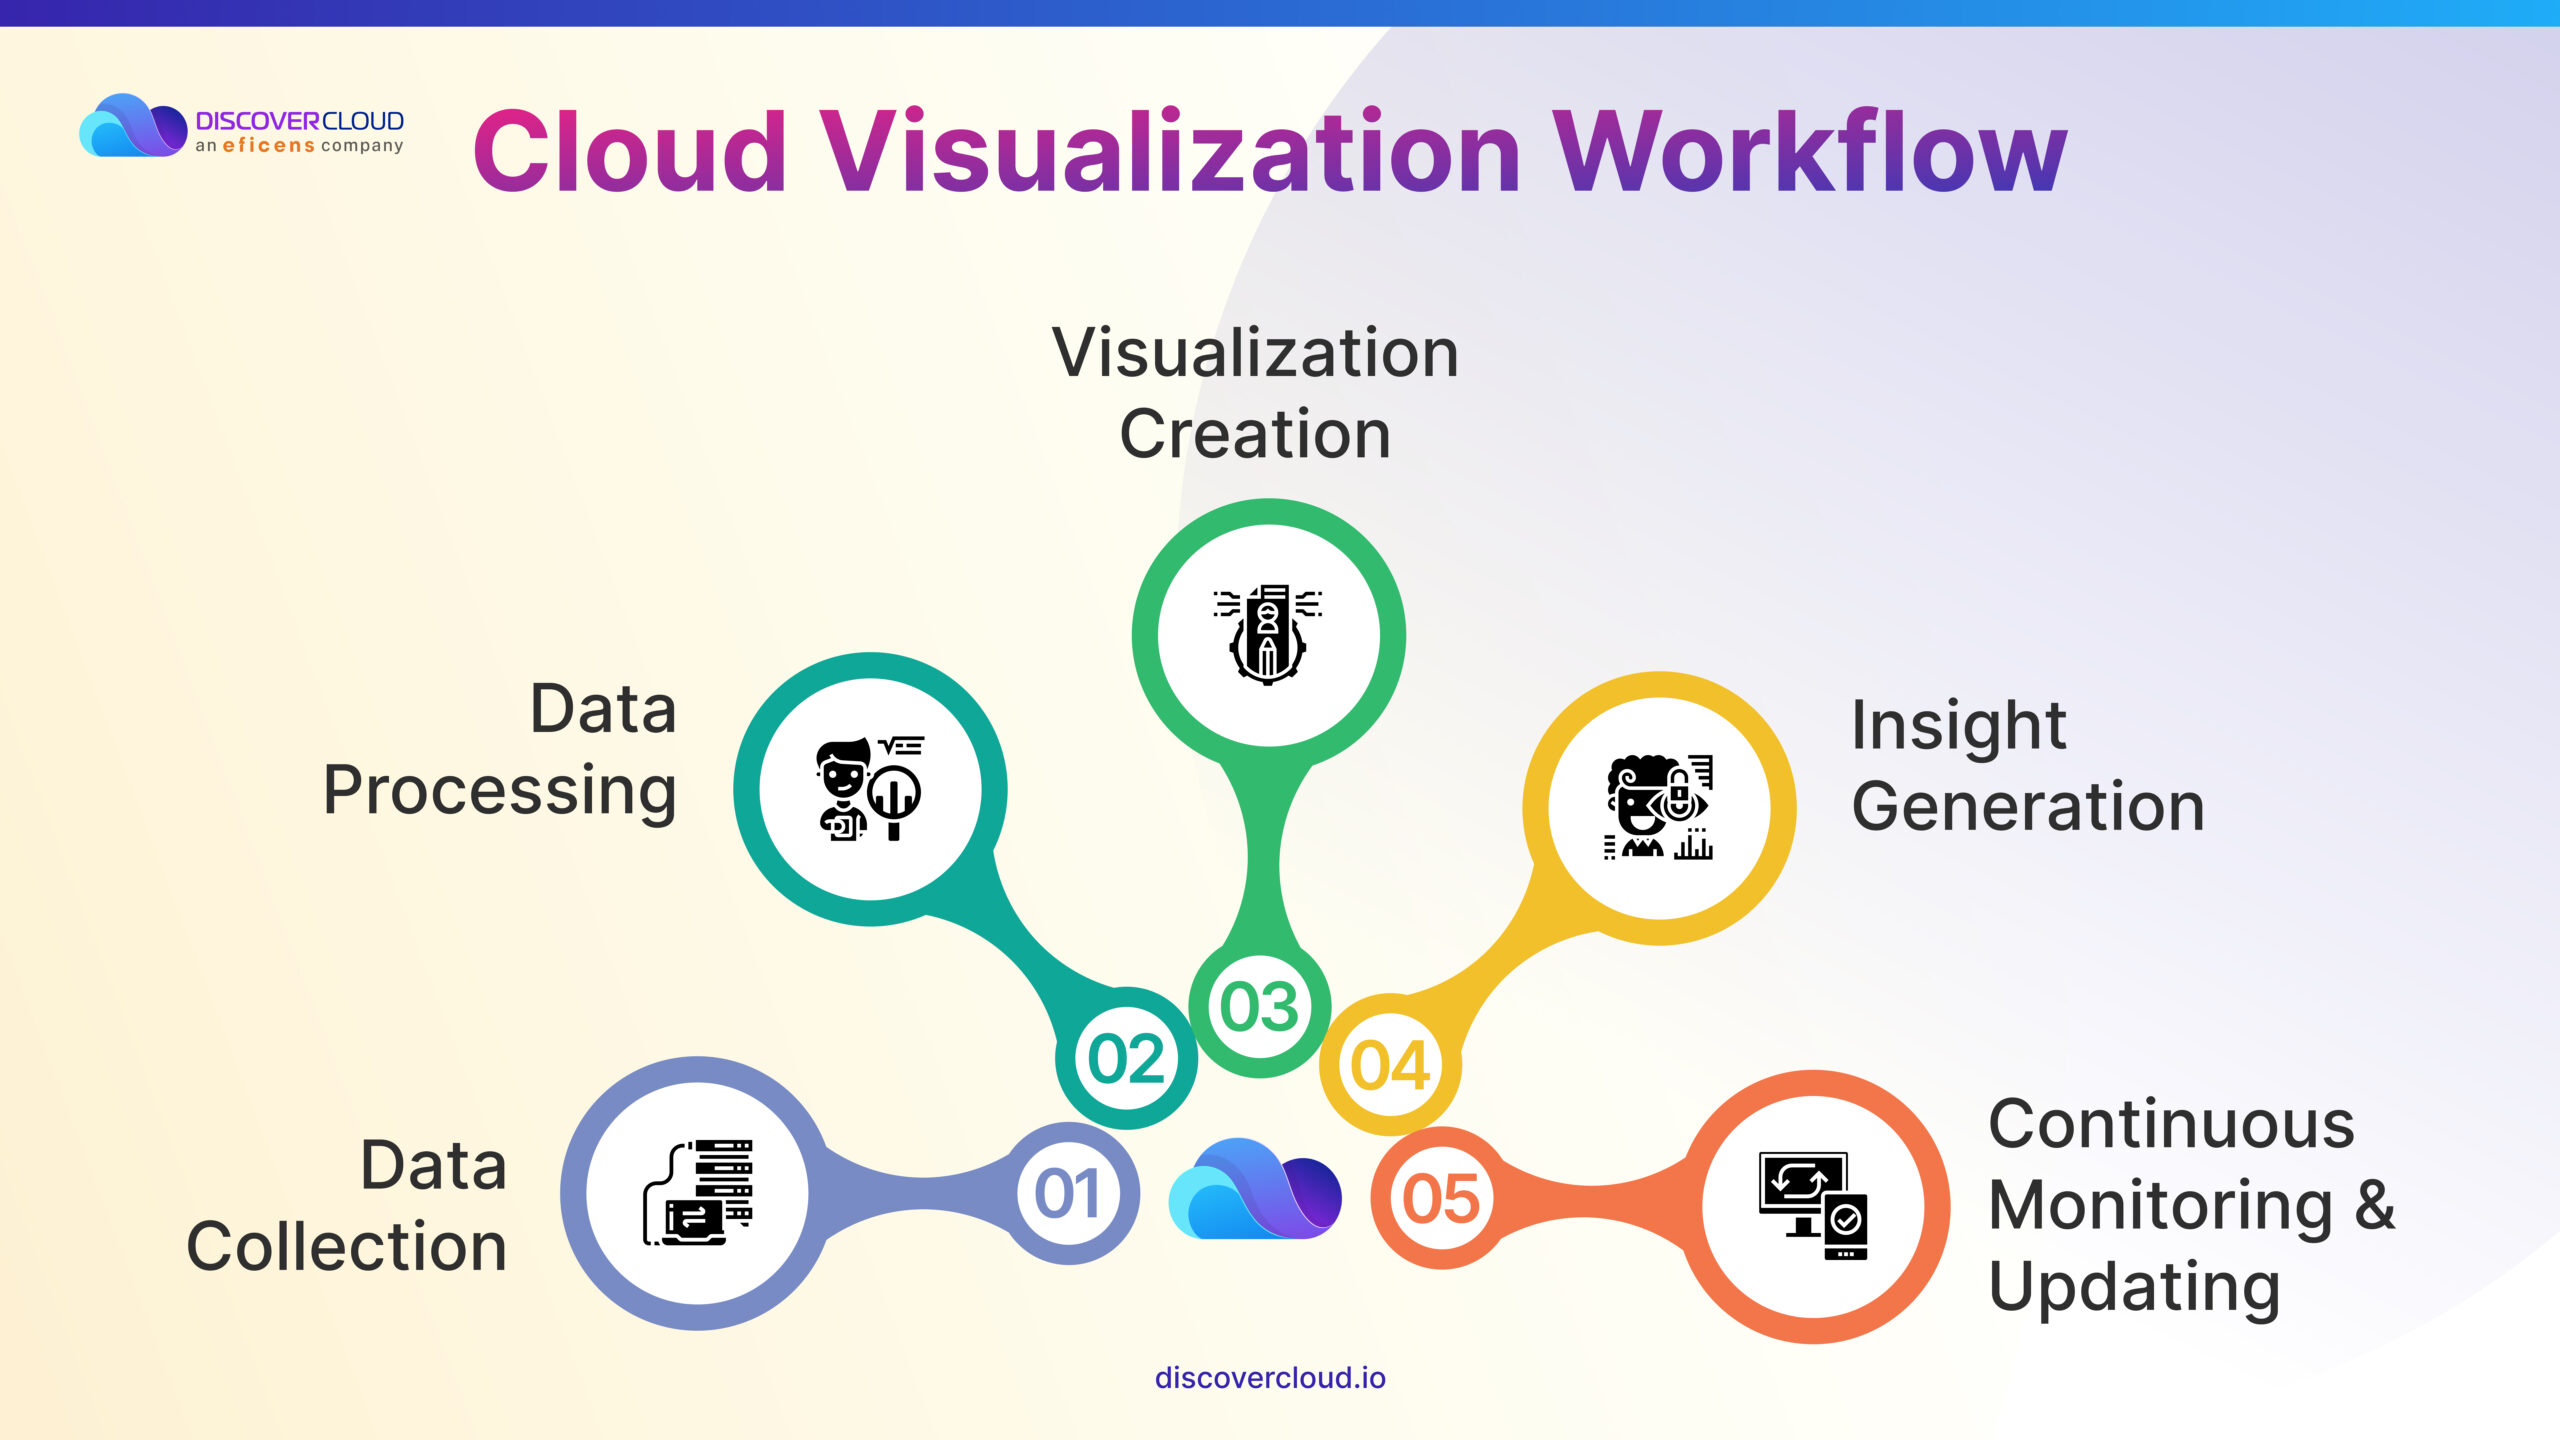
Cloud visualization operates through a series of steps and methodologies, each designed to convert complex cloud data into understandable visual formats.
- Data Collection- The process begins with gathering data from various cloud resources. This includes information about servers, storage systems, network activities, and application performance.
- Data Processing- All the data is then processed and analyzed. Here, the focus is on identifying key relationships, dependencies, and performance metrics within the cloud environment.
- Visualization Creation- Utilizing advanced cloud visualization tools, such as DiscoverCloud’s Traverse accelerator, the processed data is transformed into graphical representations. These visualizations can take various forms, such as network diagrams, heat maps, or interactive dashboards.
- Insight Generation- The visualizations help generate insights by making it easier to spot trends, identify inefficiencies, and understand the overall health and performance of the cloud infrastructure.
- Continuous Monitoring and Updating- Given the dynamic nature of cloud environments, cloud visualizations are regularly updated to reflect real-time changes and provide ongoing insight.
Employing various methodologies tailored to specific organizational needs, cloud visualization can leverage artificial intelligence for analytics, machine learning for pattern recognition, and real-time monitoring for current visualizations.
Tools like DiscoverCloud’s suite of accelerators, including the Traverse accelerator, exemplify this systematic approach, empowering organizations to effectively manage and optimize their cloud infrastructures. Such strategies are not just advantageous but essential in the realm of modern cloud management.
Key Components of Effective Cloud Visualization

Effective cloud visualization hinges on several key components, each playing a pivotal role in transforming complex cloud data into actionable insights.
- Real-Time Data- The foundation of any effective cloud visualization tool is its ability to process and display real-time data. This ensures that the visualizations are current and reflective of the latest state of the cloud environment.
- Accuracy- It’s imperative that cloud visualization reflects the true state of the cloud environment. This means ensuring the data is error-free and updated in real-time to reflect the latest changes.
- Clarity- The visualization should be intuitive and easy to interpret. It involves using distinct labels, colors, and icons for various resources and attributes while avoiding unnecessary clutter.
- Interactivity- Interactivity in cloud visualization tools allows users to delve deeper into the data, explore different perspectives, and understand the nuances of their cloud infrastructure.
- Scalability- As cloud environments grow and evolve, cloud visualization tools must be able to scale accordingly. This means handling increasing volumes of data and more complex relationships without losing performance.
- Security- Given the sensitive nature of cloud data, security is paramount. Effective cloud visualization tools must incorporate robust security measures to protect data integrity and confidentiality.
At DiscoverCloud, we strive to incorporate these elements into our cloud visualization tools, like the Traverse accelerator. Our focus is on delivering a visualization experience that is accurate, clear, and relevant, helping organizations effectively manage and optimize their cloud infrastructure.
What are the Benefits of Cloud Visualization for Businesses
Cloud visualization offers a range of benefits that can significantly enhance how businesses manage and utilize their cloud environments.
- Enhanced Understanding- It provides a clear and comprehensive view of the cloud infrastructure, making it easier for businesses to understand complex systems.
- Improved Decision Making- With a detailed visual representation, decision-makers can identify areas for optimization and innovation more effectively.
- Efficient Problem Solving- Visualizations help in quickly pinpointing issues within the cloud environment, leading to faster resolution and minimal downtime.
- Optimized Resource Management- By visually tracking resources and their utilization, businesses can optimize their cloud spending and resource allocation.
- Facilitates Collaboration- Cloud visualization tools can enhance collaboration among different teams by providing a common visual language for discussing cloud infrastructure.
- Strategic Planning- Visual insights aid in strategic planning by offering a clear picture of current cloud setups and potential future expansions or modifications.
Incorporating cloud visualization into their operations, businesses can leverage these benefits to maintain a more efficient, cost-effective, and strategically sound cloud environment.
Here’s How DiscoverCloud’s Traverse Accelerator Can Help
One of the best cloud visualization tools available in the market is DiscoverCloud’s Traverse Accelerator, a cloud-native solution that can automatically discover, map, and visualize any cloud environment, regardless of the cloud provider, platform, or service. DiscoverCloud’s Traverse accelerator is a powerhouse for AWS cloud management, revolutionizing how businesses visualize and optimize their cloud infrastructure.
- Visualize Architectures- Traverse auto-generates AWS diagrams, revealing complex resource connections with real-time data and easy customization. It also helps simplify inventory management through its user-friendly interface.
- Tailored Cloud Migration Strategies- Traverse provides customized strategies for AWS Cloud deployment, ensuring a smooth transition and effective integration.
- Quick Resource Search- With its powerful search tools, Traverse enables swift location of resources by names, tags, or IPs, enhancing decision-making and resource control.
- Resource Directory Exploration- Traverse also offers a comprehensive directory to navigate AWS resources, allowing effortless diagram building with intuitive visual cues for seamless resource discovery and management.
- Effortless Collaboration- Sharing and collaborating become straightforward with Traverse, as it allows exporting diagrams in various formats like PNG, JSON, CSV, and Draw.io, preserving insights for future reference beyond AWS discovery.
- Enhanced Decision-Making- The insights and visualizations provided by Traverse enable informed decision-making, supporting strategic business moves in the cloud.
At its core, Traverse is about empowering AWS insights. It simplifies complex architectures, aids cost optimization, and streamlines overall cloud management. It stands as your trusted ally for efficient AWS resource handling, embodying DiscoverCloud’s commitment to smart, smooth cloud operations. It empowers businesses to not only see their cloud landscape with clarity but to navigate it with confidence and strategic foresight.
Wrapping Up
At the end of the day, cloud visualization emerges as an indispensable asset in the dynamic landscape of cloud computing. It offers businesses a clear and comprehensive view of their cloud infrastructure, facilitating enhanced understanding, improved decision-making, and efficient problem-solving.
With tools like DiscoverCloud’s Traverse Accelerator leading the way, organizations can leverage real-time data, accuracy, and interactivity to optimize their cloud environments effectively, ensuring a strategic and streamlined approach to cloud management.